
Share This Article
Food and Beverage Business Model Canvas: A Practical Guide to Designing, Evaluating, and Improving F&B Business Models
Meta Description: Learn how the Food and Beverage Business Model Canvas helps restaurants, cafés, beverage brands, and other F&B businesses design stronger models, improve operations, manage costs, and align value with customer needs.
1. Introduction
The food and beverage industry is one of the most dynamic and competitive sectors in the economy. It includes restaurants, cafés, food manufacturers, beverage companies, catering providers, cloud kitchens, food trucks, franchises, bakeries, and many other formats. Demand exists across all customer segments, yet success is rarely determined by food quality alone. Strong performance usually depends on whether a business has a clear model for creating value, delivering it consistently, and converting it into sustainable profit.
A clear business model matters because F&B businesses operate under constant pressure from changing customer preferences, rising ingredient costs, labour challenges, rental commitments, regulatory requirements, and intense market competition. A busy outlet may still struggle financially if pricing, channels, operations, and partnerships are not aligned. In the same way, a strong menu concept may fail if the customer segment is unclear or if delivery economics erode margins.
The Food and Beverage Business Model Canvas helps F&B businesses design, evaluate, and improve their overall business model in a practical way. It gives operators and decision-makers a structured view of how the business serves customers, earns revenue, manages costs, coordinates resources, and builds competitive advantage. Rather than treating menu design, operations, marketing, and finance as separate issues, the canvas shows how they work together as one integrated system.
2. What Is the Business Model Canvas?
The Food and Beverage Business Model Canvas is a strategic management framework that shows how restaurants, cafés, beverage brands, catering operators, and other F&B businesses create, deliver, and capture value. Nine interrelated blocks form the framework and explain how the company serves customers, operates efficiently, and remains commercially viable. For F&B businesses, the canvas is especially useful because performance depends on balancing customer experience, product quality, speed, consistency, location, labour, supply chain, and cost discipline at the same time.
The purpose of the Food and Beverage Business Model Canvas is not only to describe an existing business. Businesses also use it to test new concepts, compare different formats, identify gaps, support expansion decisions, and clarify strategic priorities. A café can use it to refine its dine-in and takeaway mix. A cloud kitchen can use it to assess delivery platform dependence. A food manufacturer can use it to compare retail, wholesale, and direct-to-consumer channels.
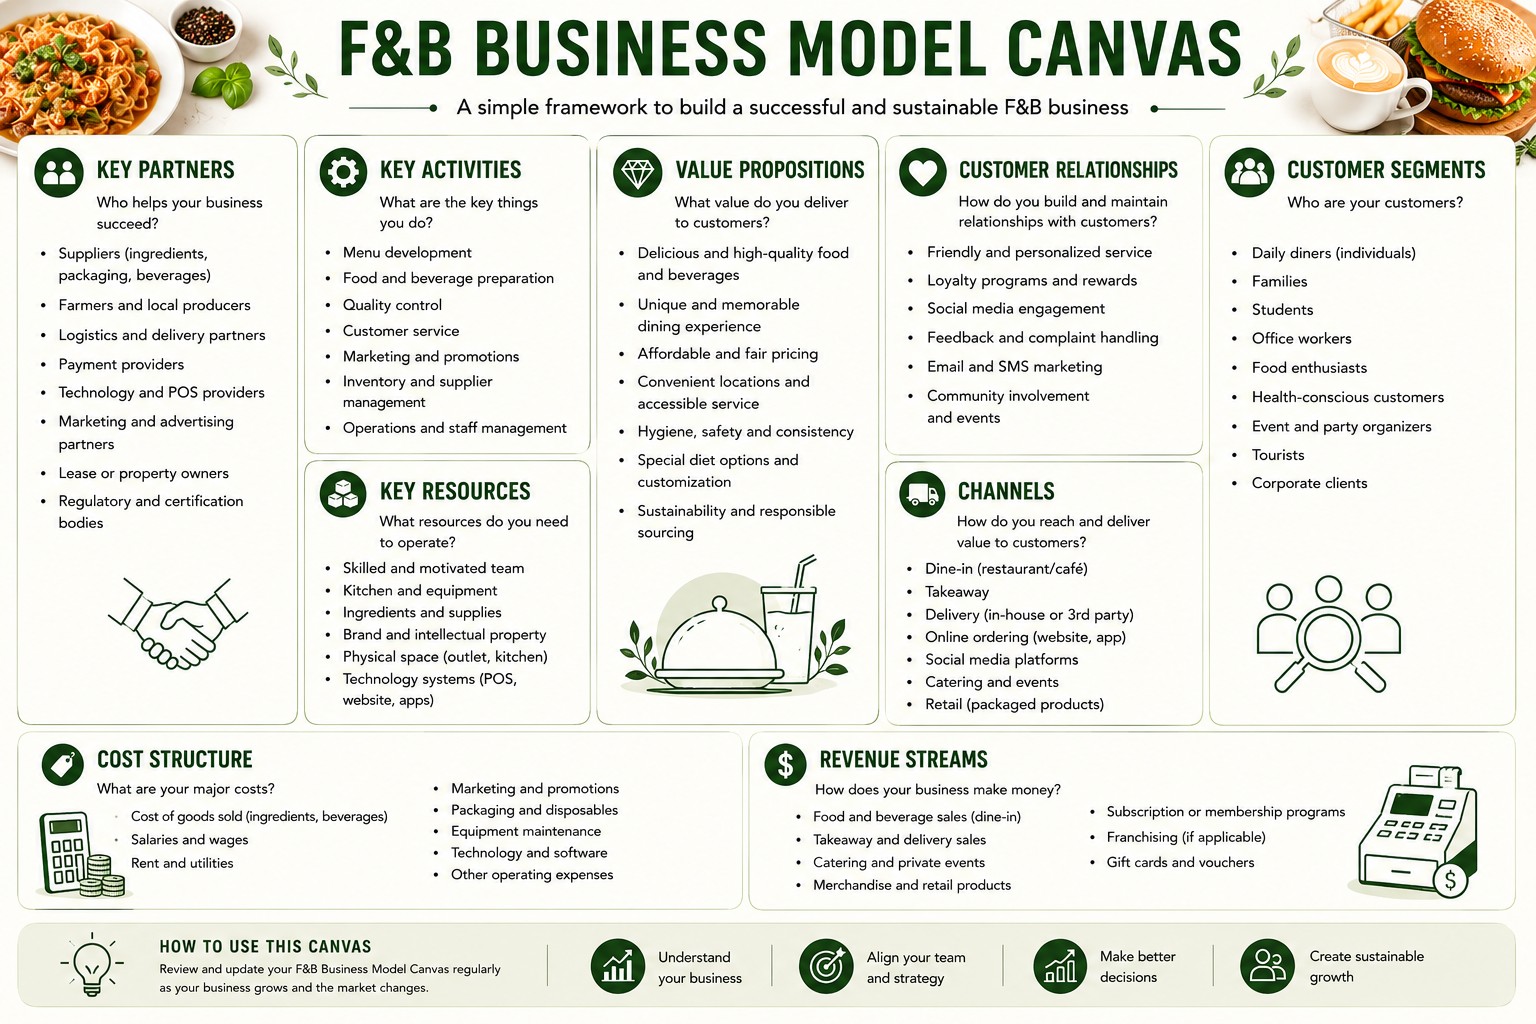
The nine blocks are Customer Segments, Value Propositions, Channels, Customer Relationships, Revenue Streams, Key Resources, Key Activities, Key Partnerships, and Cost Structure. Each block answers a critical question. Who is the customer? What value does the business offer? How does the business deliver the offer? How does the business build loyalty? Where does revenue come from? What assets, processes, partners, and costs are involved? Together, these blocks provide an integrated view of the full business model.
3. The Nine Blocks of the Food and Beverage Business Model Canvas
To understand how an F&B business works in practice, it is useful to examine each block of the canvas individually. Every block represents a different part of the business model, but none of them works in isolation. Customer choices influence value propositions, channels affect margins, resources shape execution, and cost structure determines whether the model remains sustainable. Looking at the nine blocks one by one makes the framework easier to apply, while also showing how strategic and operational decisions connect across the business.
3.1 Customer Segments
Customer Segments define the groups of people or organisations the business aims to serve. In F&B, segment choice shapes almost every strategic decision, including menu design, pricing, service style, packaging, outlet location, operating hours, and channel selection. A premium dining concept, for example, serves very different needs from a student-focused beverage kiosk or a catering company that targets corporate events.
Before building the rest of the model, an F&B business needs to know which customers matter most. Many operators fail because they try to serve too many audiences with one concept. Clear segmentation helps the business match its value proposition to specific demand patterns rather than relying on a generic offer.
Table 1: Customer Segments
The following table is a practical summary of typical customer segments found in food and beverage businesses.
| Typical Item | Description | Why It Matters |
|---|---|---|
| Families | Customers seeking convenience, variety, child-friendly options, and affordability | Influences menu breadth, seating layout, promotions, and service speed |
| Office workers | Customers needing quick meals, lunch bundles, and reliable service during working hours | Drives peak-time operations, order turnaround, and weekday sales planning |
| Students | Price-sensitive customers looking for affordable meals and social-friendly spaces | Affects pricing strategy, bundle offers, and outlet location near campuses |
| Health-conscious consumers | Customers prioritising nutrition, freshness, and dietary transparency | Supports healthier menu design, premium pricing, and brand positioning |
| Premium diners | Customers seeking ambience, quality ingredients, and elevated service | Requires a stronger value proposition, trained staff, and more refined presentation |
| Delivery customers | Customers valuing speed, convenience, and packaging quality | Makes digital ordering, logistics, and menu portability more important |
| Corporate clients | Organisations purchasing catering, event meals, or regular pantry supplies | Expands revenue sources beyond walk-in traffic and improves order predictability |
| Retail consumers | Customers purchasing packaged food or beverages through stores or supermarkets | Requires different channels, branding, and supply chain capabilities |
Analysis of Customer Segments
A strong segmentation strategy improves strategic focus. Restaurants that target office workers may prioritise lunch efficiency and digital pre-ordering, while cafés targeting remote workers may invest more in seating comfort, Wi-Fi, and repeat-visit incentives. Customer segments also affect the cost structure. Serving premium diners often requires higher ingredient quality and more labour per transaction, whereas serving students may depend on tighter portion control and volume-based economics.
Common mistakes include targeting broad audiences without clear priorities, assuming all customers value the same thing, or copying competitor segments without validating local demand. Practical analysis should consider transaction size, visit frequency, time-of-day patterns, price sensitivity, and service expectations. In F&B, segment clarity is one of the earliest indicators of business model strength.
3.2 Value Propositions
Value Propositions explain why customers choose one F&B business over another. In this industry, value goes far beyond food itself. Customers may be paying for taste, convenience, speed, consistency, ambience, affordability, health, novelty, social experience, or trust in quality and hygiene. The strongest F&B businesses do not compete on everything. Instead, they define the specific value they deliver best.
A value proposition should reflect the needs of the chosen customer segments. A cloud kitchen may win through delivery convenience and affordable bundles. A specialty café may win through premium beans, atmosphere, and brand identity. A catering business may win through reliability, volume handling, and event coordination.
Table 2: Value Propositions
The following table is a practical overview of the value propositions commonly used in F&B business models.
| Typical Item | Description | Why It Matters |
|---|---|---|
| Great taste | Strong flavour quality and an enjoyable food or beverage experience | Remains a core reason for repeat purchase and word-of-mouth growth |
| Convenience | Easy ordering, quick access, and time-saving service | Important for modern consumers with busy lifestyles |
| Affordability | Competitive pricing, bundle deals, and value-for-money offers | Attracts price-sensitive segments and supports volume sales |
| Consistency | Reliable quality across visits, shifts, or locations | Builds trust and strengthens brand loyalty |
| Speed | Fast preparation, delivery, or checkout processes | Critical during peak hours and for grab-and-go formats |
| Premium quality | Better ingredients, presentation, and service standards | Supports higher pricing and more differentiated positioning |
| Health and wellness | Nutritious options, transparent ingredients, and dietary suitability | Responds to growing consumer awareness and specialised demand |
| Memorable experience | Ambience, service, storytelling, and social appeal | Creates emotional differentiation beyond functional food value |
Analysis of Value Propositions
The value proposition must be operationally supportable. A brand promising speed cannot rely on slow kitchen processes. A concept positioned on premium quality cannot compromise sourcing consistency. Strategic fit matters because weak alignment between promise and execution damages both margins and reputation.
One common mistake is offering conflicting propositions, such as premium quality at mass-market pricing without the scale to support it. Another is relying on taste alone while ignoring convenience, digital access, or service reliability. In practice, a beverage brand may build value through flavour innovation and lifestyle branding, while a quick-service outlet may focus on speed, standardisation, and affordability. The sharper the proposition, the easier it becomes to align the rest of the model.
3.3 Channels
Channels describe how an F&B business reaches customers and delivers its products or services. These channels may be physical, digital, direct, or indirect. In F&B, channel choices are highly influential because they affect demand generation, customer convenience, cost to serve, brand experience, and revenue mix.
A restaurant may rely on dine-in, takeaway, self-pickup, and delivery platforms at the same time. A food manufacturer may use supermarkets, distributors, convenience stores, e-commerce marketplaces, and direct online sales. Each channel comes with different economics, control levels, and customer expectations.
Table 3: Channels
The following table is a summary of the main channels F&B businesses use to reach customers and deliver value.
| Typical Item | Description | Why It Matters |
|---|---|---|
| Dine-in outlet | Physical location where customers consume on site | Shapes customer experience, service style, and location economics |
| Takeaway | Orders collected directly by customers | Improves convenience and increases throughput with lower seating needs |
| Delivery platforms | Third-party apps such as food delivery marketplaces | Expands reach quickly but may reduce margins and customer ownership |
| Own website or app | Direct digital ordering channel controlled by the business | Supports better customer data, branding, and margin retention |
| Retail stores | Supermarkets, convenience stores, or specialty retailers | Important for packaged F&B products and wider market penetration |
| Distributors | Intermediaries that place products into multiple outlets or regions | Useful for scaling distribution efficiently |
| Catering sales | Direct B2B or event-based fulfilment channels | Creates bulk-order opportunities and recurring business |
| Social media commerce | Customer acquisition and order generation through digital platforms | Helps discovery, promotion, and brand engagement |
Analysis of Channels
Channel strategy must balance reach, control, and profitability. Delivery platforms can accelerate sales, yet overdependence may weaken margins and reduce direct customer relationships. Physical outlets provide stronger brand control, but they also require higher fixed costs. A packaged beverage company may benefit from retail penetration, but brand visibility on shelf depends on trade partnerships and merchandising execution.
Typical mistakes include expanding into too many channels without operational readiness, pricing the same across channels despite different cost structures, or neglecting direct channels while paying excessive commissions to intermediaries. Practical channel analysis should include fulfilment speed, average order value, margin by channel, customer acquisition cost, and channel-specific service expectations.
3.4 Customer Relationships
Customer Relationships explain how an F&B business attracts, serves, retains, and grows its customer base. In this industry, relationships are built through service quality, consistency, trust, convenience, responsiveness, and emotional connection to the brand. Some relationships are highly personal, such as in premium dining or catering. Others are more automated, such as app-based loyalty for quick-service brands.
The customer segment and business format determine the right relationship model. A neighbourhood café may build loyalty through familiarity and community presence. A delivery-first brand may rely more on app convenience, reviews, and personalised promotions.
Table 4: Customer Relationships
The following table is an outline of the relationship approaches often used to attract, retain, and grow F&B customers.
| Typical Item | Description | Why It Matters |
|---|---|---|
| Friendly in-store service | Human interaction that makes customers feel welcomed and valued | Encourages repeat visits and positive brand perception |
| Loyalty programmes | Rewards, points, or member benefits for repeat purchases | Increases retention and lifetime value |
| Personalised promotions | Tailored offers based on purchase history or customer profile | Improves conversion and campaign efficiency |
| Responsive complaint handling | Fast resolution of service or quality issues | Protects trust and reduces reputational damage |
| Community engagement | Social media interaction, events, and brand storytelling | Builds deeper emotional connection with customers |
| Self-service ordering | Kiosks, QR code ordering, or app-based ordering systems | Improves efficiency and reduces service friction |
| Subscription or recurring plans | Meal plans, coffee subscriptions, or standing orders | Stabilises revenue and strengthens habitual consumption |
| After-sales follow-up for B2B | Relationship management with corporate or catering clients | Supports retention and larger account growth |
Analysis of Customer Relationships
Strong relationships increase retention and reduce the cost of constantly replacing lost customers. For F&B businesses, this is especially important because repeat purchase often drives profitability more reliably than one-time trial. Relationship strength also affects review quality, referral behaviour, and tolerance during service recovery situations.
Weak relationship models often appear when operators focus only on transactions. Businesses may attract customers through promotions but fail to retain them because service quality is inconsistent or feedback is ignored. A practical example is a café that combines good beverages with a simple loyalty programme and prompt online engagement. Over time, that relationship system becomes a competitive asset, not just a marketing activity.
3.5 Revenue Streams
Revenue Streams describe how the F&B business earns money from its customer segments. In many cases, operators think only in terms of menu sales. In reality, F&B businesses often have multiple revenue streams that improve resilience, increase average spend, and reduce dependence on a single demand source.
A restaurant may earn from dine-in meals, takeaway, delivery, private events, and branded merchandise. A beverage company may combine retail sales, wholesale distribution, licensing, and seasonal promotions. Revenue design matters because margin profiles differ across products, formats, customer groups, and channels.
Table 5: Revenue Streams
The following table is a summary of the revenue streams commonly found in food and beverage businesses.
| Typical Item | Description | Why It Matters |
|---|---|---|
| Dine-in sales | Revenue from food and beverage consumed on site | Often supports higher average spend and a stronger brand experience |
| Takeaway sales | Revenue from direct pickup orders | Improves volume without requiring extra dining space |
| Delivery sales | Revenue from online delivery channels | Expands access to convenience-driven consumers |
| Catering revenue | Bulk sales for meetings, parties, or corporate functions | Increases order size and supports planning visibility |
| Retail packaged products | Sales of bottled drinks, sauces, snacks, or ready-to-eat items | Extends the brand beyond outlet-based transactions |
| Subscription plans | Recurring sales through prepaid meals or beverage packages | Improves cash flow stability and repeat demand |
| Franchise fees or royalties | Income from franchised outlet operations | Creates scalable revenue with lower direct operating involvement |
| Add-ons and upselling | Desserts, sides, premium toppings, or combo upgrades | Raise average transaction value and profitability |
Analysis of Revenue Streams
A healthy revenue model requires balance between volume, pricing, margin, and predictability. High sales do not automatically mean strong business performance if the mix is dominated by low-margin channels or heavily discounted items. Operators should assess revenue by channel, daypart, customer type, and product category.
Common mistakes include weak upselling design, overreliance on promotional pricing, and failing to develop complementary streams such as catering or packaged products. A cloud kitchen, for instance, may improve resilience by launching several menu brands from the same kitchen. A café may increase profitability by selling beans, bottled beverages, and seasonal gift sets alongside regular service.
3.6 Key Resources
Key Resources are the assets the business needs to operate and deliver its value proposition. In F&B, these resources include physical assets, human capabilities, brand strength, recipes, supplier access, systems, and sometimes intellectual property. Without the right resources, even a promising concept will struggle to execute consistently.
The resource base varies by format. A quick-service chain needs standardised kitchen equipment, trained staff, and reliable sourcing. A premium restaurant may depend more heavily on chef talent, ambience, and service capability. A food manufacturer requires production facilities, quality control systems, and distribution support.
Table 6: Key Resources
The following table is an overview of the key resources that typically support F&B operations and growth.
| Typical Item | Description | Why It Matters |
|---|---|---|
| Location | Physical outlet position, visibility, and accessibility | Strongly influences traffic, convenience, and rental economics |
| Kitchen equipment | Ovens, refrigeration, beverage machines, and preparation tools | Supports product quality, speed, and capacity |
| Skilled staff | Chefs, baristas, servers, delivery coordinators, and managers | Essential for execution, consistency, and customer experience |
| Brand and reputation | Customer trust, recognition, and perceived quality | Drives customer choice and repeat business |
| Recipes and product know-how | Proprietary formulations, menus, and preparation methods | Create differentiation and support standardisation |
| Supplier network | Reliable access to raw materials and packaging | Reduces disruption and maintains quality consistency |
| Digital systems | POS, inventory tools, ordering platforms, and CRM systems | Improve control, data visibility, and operational efficiency |
| Licences and compliance capability | Food handling approvals, safety processes, and legal certifications | Protect the business from regulatory and reputational risks |
Analysis of Key Resources
Resource analysis should focus on scarcity, reliability, and strategic importance. Not every resource is equally valuable. Some are easy to replace, while others, such as a trusted brand, a prime location, or a well-developed operating system, are much harder to replicate.
Typical mistakes include underinvesting in staff capability, treating systems as optional, or assuming sourcing access will remain stable without supplier management. In practice, a successful beverage kiosk may rely on brand visibility, standard recipes, and fast equipment, while a catering business may depend more on logistics coordination, event execution capability, and client management expertise.
3.7 Key Activities
Key Activities are the most important actions the business must perform to make the model work. In F&B, these activities cover much more than cooking or serving. They include menu development, procurement, production, quality assurance, order fulfilment, customer service, hygiene control, marketing, workforce scheduling, and performance management.
Activity design matters because many F&B businesses fail not because the concept is weak, but because execution is inconsistent. A strong business model translates into repeatable activities that maintain quality, speed, safety, and customer satisfaction across shifts, outlets, or channels.
Table 7: Key Activities
The following table is a practical breakdown of the main activities that keep an F&B business running effectively.
| Typical Item | Description | Why It Matters |
|---|---|---|
| Menu planning | Designing products, pricing, and item mix | Influences demand, margin, and operational complexity |
| Food preparation | Cooking, assembly, and beverage production | Directly affects taste, speed, and consistency |
| Procurement | Sourcing ingredients, packaging, and supplies | Supports quality, continuity, and cost control |
| Inventory management | Monitoring stock levels, shelf life, and wastage | Reduces spoilage, stockouts, and margin leakage |
| Quality control | Ensuring food standards, hygiene, and service consistency | Protects brand reputation and customer trust |
| Marketing and promotion | Running campaigns, launches, and customer engagement efforts | Drive traffic, awareness, and repeat sales |
| Order fulfilment | Managing dine-in, takeaway, delivery, or event execution | Determines customer convenience and service reliability |
| Training and supervision | Developing staff capability and enforcing SOPs | Improve consistency and support scaling |
Analysis of Key Activities
Well-chosen activities create operational discipline. A cloud kitchen, for example, must excel in digital order coordination, packaging accuracy, and delivery readiness. A premium restaurant must pay closer attention to service choreography, plating standards, and reservation management.
Frequent mistakes include overcomplicated menus, poor stock planning, weak SOP adherence, and reactive scheduling. These issues usually affect both quality and profitability at once. Effective F&B operators simplify where possible, standardise what matters, and monitor the activities that have the strongest effect on customer experience and margins.
3.8 Key Partnerships
Key Partnerships describe the external parties that help the F&B business operate, grow, or reduce risk. In this sector, partners often play a major role because food production and service depend on timely supply, logistics coordination, technology support, compliance, and market access.
Partnership choices should support the broader business model. A delivery-first business needs dependable logistics platforms. A packaged food business may rely on distributors and retailers. A franchise system needs partners that can replicate standards consistently.
Table 8: Key Partnerships
The following table is a summary of the partnerships that often strengthen F&B business performance and resilience.
| Typical Item | Description | Why It Matters |
|---|---|---|
| Ingredient suppliers | Providers of fresh produce, meat, dairy, dry goods, or beverages | Critical for quality, pricing stability, and continuity |
| Packaging suppliers | Providers of takeaway and delivery packaging materials | Support presentation, food safety, and delivery suitability |
| Delivery platforms | Third-party digital marketplaces and logistics channels | Expand customer reach and convenience |
| Technology vendors | POS, ordering, loyalty, and analytics system providers | Improve efficiency and decision-making capability |
| Distributors | Partners that place products into retail or wholesale channels | Enable scale and market access |
| Landlords or site owners | Property partners providing business premises | Affect cost structure, location quality, and operational terms |
| Franchisees or franchise support partners | Operators that expand the brand footprint | Help growth but require strong control mechanisms |
| Event organisers or corporate clients | Partners generating repeat bulk orders or collaborations | Support predictable revenue and brand visibility |
Analysis of Key Partnerships
Partnerships can strengthen resilience, but they also create dependency. An F&B business that relies too heavily on one supplier or one delivery platform becomes vulnerable to disruption, price changes, or bargaining pressure. Strategic analysis should therefore assess partner concentration, switching costs, and service quality.
A common mistake is treating suppliers as transactional vendors without structured performance management. Another is using third-party channels for growth without developing direct customer access. A practical example is a restaurant that maintains two key suppliers for major ingredients while simultaneously investing in its own ordering system to reduce platform dependency over time.
3.9 Cost Structure
Cost Structure describes the major costs required to operate the F&B business model. In food and beverage, cost discipline is essential because margins can be narrow and cost volatility is common. Food prices, labour expenses, rental, utilities, packaging, delivery commissions, and spoilage all affect profitability directly.
Cost analysis is more useful when linked to the rest of the business model. Premium concepts may accept higher costs in exchange for stronger pricing power. Value-driven concepts must tightly manage cost efficiency because pricing flexibility is limited. The right question is not only how to reduce cost, but how to align cost with the chosen value proposition and customer segment.
Table 9: Cost Structure
The following table is a practical view of the main cost categories that shape F&B profitability.
| Typical Item | Description | Why It Matters |
|---|---|---|
| Ingredients and raw materials | Food, beverages, condiments, and preparation inputs | Usually one of the most significant variable cost drivers |
| Labour | Kitchen staff, servers, cleaners, supervisors, and managers | Strongly affects service quality and operating capacity |
| Rental | Outlet lease, service charges, and common area fees | Important fixed cost, especially in high-traffic locations |
| Utilities | Electricity, water, gas, and waste handling | Can materially affect profitability in production-heavy operations |
| Packaging | Containers, cups, bags, labels, and protective materials | Essential for takeaway and delivery economics |
| Technology costs | POS, subscription software, online ordering systems, and maintenance | Support control but add recurring expenditure |
| Marketing spend | Promotions, campaigns, content creation, and partnerships | Needed for traffic generation and brand building |
| Wastage and spoilage | Expired stock, preparation waste, and damaged inventory | Reduce margin and reflect weak process control |
Analysis of Cost Structure
A well-managed cost structure distinguishes between fixed costs, variable costs, and avoidable inefficiencies. Ingredient inflation may be unavoidable, but excessive wastage often reflects poor forecasting or menu design. Labour cost may be high, yet it can still be justified if it supports a differentiated service experience and strong average spend.
Common mistakes include underestimating delivery-related costs, ignoring hidden wastage, and setting prices without understanding contribution margins. In practice, an F&B business should review item-level profitability, labour productivity, packaging impact, and channel commissions regularly. Strong cost management does not mean cutting quality blindly. It means spending intentionally in the areas that reinforce the chosen business model.
4. How the Nine Blocks of the Food and Beverage Business Model Canvas Work Together
The nine Business Model Canvas blocks are interconnected, which means a decision in one block often changes the economics or requirements of several others. In F&B, this interdependence is especially visible because customer expectations, food operations, channel design, labour, and cost structure are tightly linked. A business model becomes effective only when the blocks reinforce one another rather than pull in different directions.
Consider an F&B business that chooses premium diners as its main customer segment. That decision influences the value proposition toward quality ingredients, refined presentation, and superior service. Channels may focus more on dine-in, reservations, and curated digital branding rather than mass delivery platforms. Customer relationships may require more personalised service and stronger service recovery. Revenue streams may support higher pricing, but key resources must include skilled chefs, trained front-of-house staff, and a high-quality location. Key activities become more complex because plating, quality control, and ambience management matter more. Partnerships may shift toward specialty suppliers, while cost structure rises due to labour, rent, and ingredients.
A different example is a cloud kitchen targeting convenience-driven delivery customers. The value proposition emphasises speed, price, packaging quality, and app visibility. Channels depend heavily on delivery platforms and digital ordering. Customer relationships become more data-driven and less personal. Key resources focus on kitchen efficiency, digital systems, and menu engineering. Cost structure may include lower front-of-house costs but higher commission pressure and packaging expenses.
For that reason, F&B businesses should avoid optimising one block in isolation. Sustainable performance comes from designing a model in which customer choice, value delivery, operational capability, revenue logic, and cost discipline work as one coherent system.
5. Value Proposition Canvas and the Food and Beverage Business Model Canvas
The Value Proposition Canvas complements the Food and Beverage Business Model Canvas by providing a more detailed view of how the business creates value for specific customers. While the Business Model Canvas gives a broad picture of the entire business model, the Value Proposition Canvas focuses more closely on the fit between what customers need and what the business offers. For F&B businesses, this is particularly useful because customer choice is shaped by both functional needs and emotional drivers.
Food and beverage customers do not buy products only to satisfy hunger or thirst. They may also be looking for convenience, comfort, social status, enjoyment, wellness, familiarity, speed, or an experience worth repeating. A café serving office workers solves a different set of problems from a catering business serving corporate functions or a beverage brand targeting health-conscious consumers.
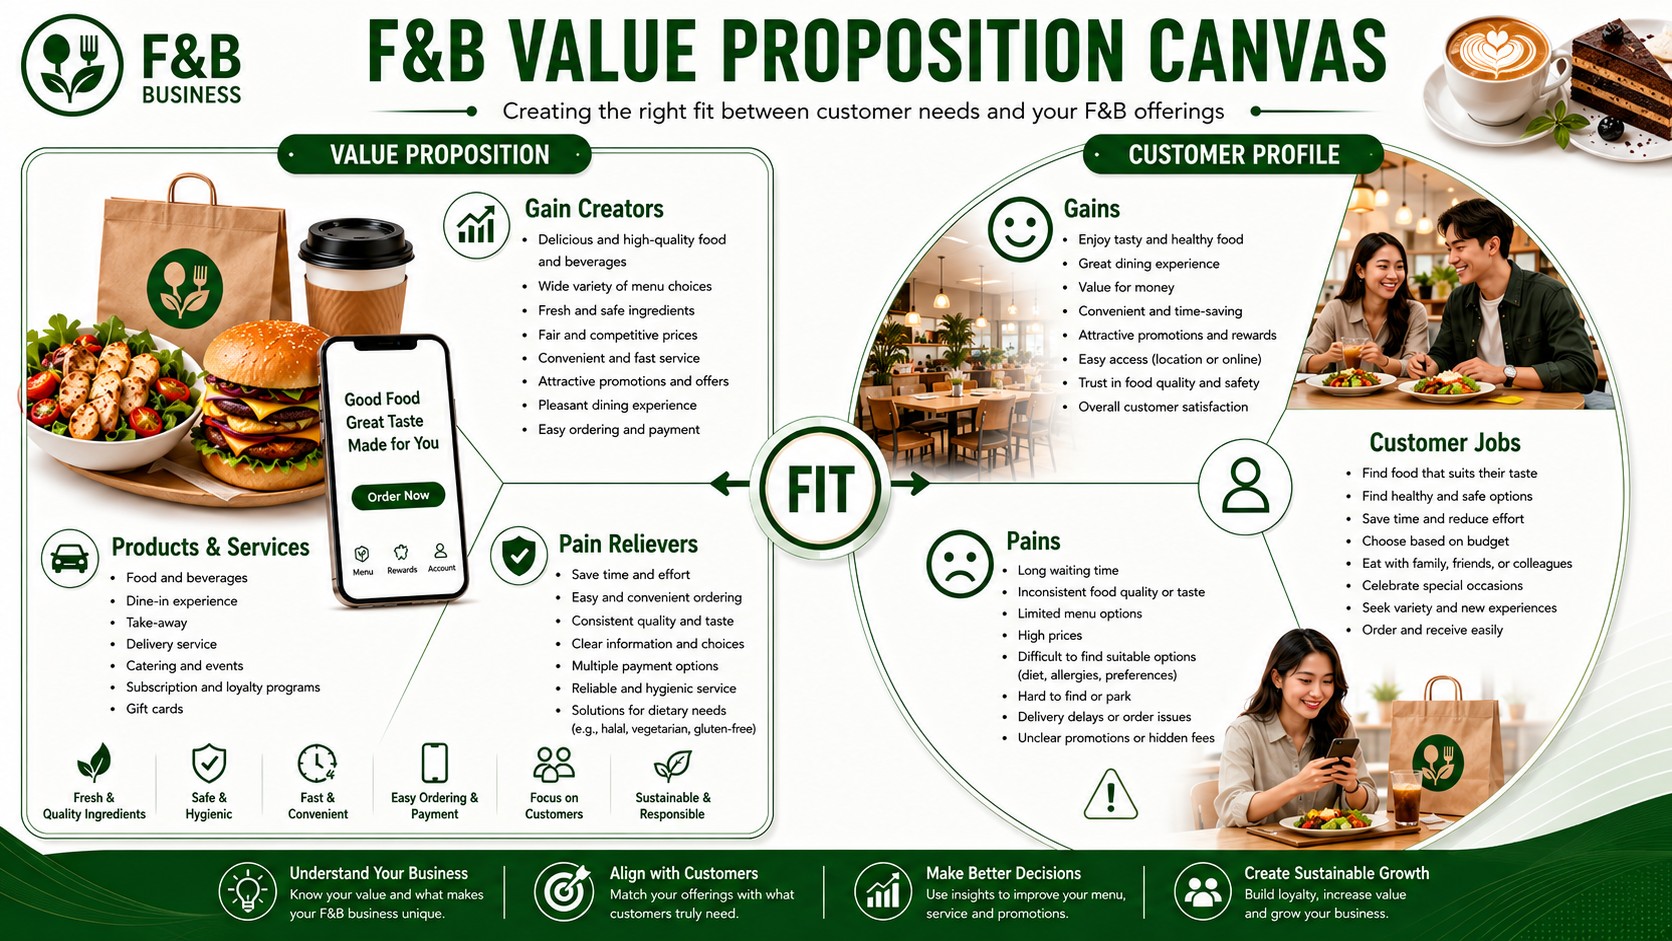
The Value Proposition Canvas has two main components. The first is the Customer Profile, which examines what customers are trying to get done, what frustrates them, and what they hope to gain. The second is the Value Map, which describes the products and services offered, how the business relieves pain, and how it creates positive outcomes for customers.
When used well, this framework helps F&B businesses move beyond assumptions. Instead of launching menus or promotions based on internal preferences, operators can design offers that match real customer priorities. That makes the business model more focused, more relevant, and more commercially effective.
5.1 Customer Profile
The Customer Profile helps F&B businesses understand what matters most to their customers. It is organised around three elements: customer jobs, customer pains, and customer gains. Customer jobs refer to what customers are trying to do, solve, or achieve. Customer pains capture the frustrations, risks, or obstacles they experience. In contrast, customer gains refer to the positive outcomes they want, expect, or would be delighted to receive.
Across F&B businesses, these elements vary by segment, occasion, and context. A family dining out on the weekend has different jobs and pains from an office worker buying lunch during a tight break. Meanwhile, a health-conscious consumer may care deeply about nutritional transparency, while a convenience-driven customer may prioritise fast delivery over ambience.
Table 10: Customer Jobs
The following table is a summary of common customer jobs in food and beverage settings.
| Typical Customer Need or Behaviour | Description | F&B Example |
|---|---|---|
| Eat quickly during a short break | Customer needs a fast and reliable meal solution | Office worker buying lunch between meetings |
| Socialise in a comfortable environment | Customer wants food and beverages in a pleasant setting | Friends meeting at a café after work |
| Feed a group efficiently | Customer needs meals for family or event participants | Parent choosing a family set meal |
Table 11: Customer Pains
The following table is a summary of the common frustrations and obstacles F&B customers experience.
| Typical Customer Need or Behaviour | Description | F&B Example |
|---|---|---|
| Long waiting times | Delays reduce satisfaction and may prevent purchase | Queue building during a lunch rush |
| Poor delivery condition | Food arrives late, cold, or damaged | Spilled drink and soggy fries in a delivery order |
| Unclear ingredients or allergens | Customer feels uncertain about safety or suitability | Customer unable to confirm whether a dish contains nuts |
Table 12: Customer Gains
The following table is a summary of the outcomes and benefits customers most often value.
| Typical Customer Need or Behaviour | Description | F&B Example |
|---|---|---|
| Consistent quality | Customer wants the same good experience every time | Repeat customer ordering the same signature drink |
| Good value for money | Customer wants strong perceived benefit relative to price | Student choosing a combo meal with a drink |
| Easy and convenient ordering | Customer values low-friction access and payment | Customer placing an app order for pickup |
| Enjoyable experience | Customer wants more than simple food consumption | Diners choosing a café for ambience and comfort |
Customer Profile analysis should be evidence-based. Businesses can identify customer jobs, pains, and gains through interviews, sales patterns, review analysis, observation, delivery data, and customer feedback. Prioritisation matters because not all needs are equally important. Some are critical purchase drivers, while others are secondary.
One common mistake is focusing only on obvious jobs, such as hunger, while ignoring emotional and situational needs. In reality, many F&B purchases are also about speed, mood, convenience, identity, or social context. Strong operators validate which pains reduce conversion and which gains encourage repeat purchase, then use that insight to refine both offer design and operations.
5.2 Value Map
The Value Map explains how the F&B business responds to customer needs identified in the Customer Profile. It includes three elements: products and services, pain relievers, and gain creators. Products and services are the actual offerings the business provides. Pain relievers describe how the business reduces customer frustration or risk. Gain creators explain how the business generates additional value or positive outcomes that customers appreciate.
In F&B, the Value Map should go beyond listing menu items. It should show how the total offering solves real customer problems and improves the overall experience. Fast service, clear dietary information, reliable packaging, attractive ambience, and personalised rewards can all be important parts of the value map.
Table 13: Products and Services
The following table is an overview of the core products and services that make up the F&B offer.
| Typical Offering or Action | Description | F&B Example |
|---|---|---|
| Core menu items | Main food and beverage products sold to customers | Signature rice bowls, coffee drinks, or healthy smoothies |
| Delivery and pickup options | Access channels that improve convenience | Same-day delivery and scheduled self-pickup |
| Loyalty programme | Structured repeat-purchase benefit system | Buy-9-get-1 coffee reward |
Table 14: Pain Relievers
The following table is a summary of the actions and features that reduce customer pain points.
| Typical Offering or Action | Description | F&B Example |
|---|---|---|
| Fast preparation process | Reduces waiting frustration and improves reliability | Express lunch menu for office workers |
| Better packaging | Protects food quality during transport | Spill-resistant cup lids and insulated bags |
| Allergen and nutrition information | Reduces uncertainty and supports informed choice | Menu labels for calories and allergen warnings |
Table 15: Gain Creators
The following table is an overview of the elements that create additional value and positive outcomes for customers.
| Typical Offering or Action | Description | F&B Example |
|---|---|---|
| Premium ingredients | Increase perceived quality and satisfaction | Single-origin beans or fresh artisanal ingredients |
| Personalised promotions | Make the offer more relevant to the customer | Birthday vouchers or custom app offers |
| Memorable dining experience | Creates emotional value beyond product utility | Themed décor, attentive service, and distinctive presentation |
| Menu variety for different needs | Expands appeal across occasions or dietary preferences | Vegan, low-sugar, and family bundle choices |
A strong value map addresses the most important customer pains and gains rather than trying to offer everything. Some businesses overbuild their menu or features without solving the core reasons customers buy. Others deliver good products but fail to remove friction in ordering, waiting, or delivery.
Effective F&B businesses connect the value map to operational capability. There is little benefit in promising fast delivery or personalised offers if systems and processes cannot support them. The best value maps are not only attractive in theory. They are also repeatable, commercially viable, and consistent in daily execution.
5.3 Achieving Fit Between the Customer Profile and Value Map
“Fit” in the Value Proposition Canvas happens when the business offering meaningfully matches what customers are trying to achieve, what frustrates them, and what they value most. In F&B, fit exists when products and services support important customer jobs, pain relievers reduce significant problems, and gain creators deliver outcomes that customers genuinely appreciate.
Fit matters because many F&B concepts fail not from lack of effort, but from weak alignment. A business may launch attractive products, yet still miss the real purchase driver. Customers may care more about speed, convenience, or price clarity than about menu creativity. In another case, a premium audience may want a curated dining experience rather than broad menu variety.
Table 16: Achieving Fit Between the Customer Profile and Value Map
The following table is a practical illustration of how customer needs can be matched with the value map.
| Customer Job, Pain, or Gain | Matching Value Map Element | How the Fit Is Created | F&B Example |
|---|---|---|---|
| Need a quick weekday meal | Express menu and rapid preparation | Reduces waiting time and supports time-sensitive purchase decisions | Quick-service lunch set for office workers |
| Frustration with poor delivery quality | Protective packaging and streamlined dispatch processes | Preserves food condition and improves delivery satisfaction | Cloud kitchen using sealed containers and timed dispatch |
| Want healthier meal options | Nutritional menu design and ingredient transparency | Supports health goals and reduces uncertainty | Salad and protein bowl brand with calorie labels |
| Want consistent quality | SOP-based production and staff training | Improves repeatability across visits or outlets | Franchise beverage chain with standard preparation procedures |
| Want better value for money | Combo pricing and loyalty rewards | Increases perceived benefit relative to spending | Student meal bundle with repeat-purchase points |
| Want an enjoyable social experience | Ambience, seating comfort, and friendly service | Creates emotional value beyond food consumption | Café designed for small-group meetups |
It is important to distinguish between assumed fit and validated fit. Assumed fit exists when management believes the offer matches customer needs, but that belief has not been tested properly. Validated fit exists when evidence shows customers respond positively through purchases, repeat visits, strong reviews, higher basket sizes, and retention behaviour.
F&B businesses can test fit through menu performance, customer interviews, review sentiment, loyalty usage, delivery ratings, repeat order patterns, and controlled experiments. A concept becomes stronger when decisions are based on actual behaviour rather than intuition alone.
6. Risks and Challenges in the Food and Beverage Business Model Canvas
F&B businesses face a wide range of risks that can affect growth, profitability, consistency, and long-term sustainability. These risks are rarely isolated. In practice, one disruption often affects several Business Model Canvas blocks at once. For example, ingredient inflation may pressure value propositions, pricing decisions, partner relationships, and cost structure simultaneously.
Understanding these risks through a Food and Beverage Business Model Canvas lens helps operators respond more systematically. Instead of treating each problem as a standalone issue, leaders can assess which part of the model is exposed and which supporting blocks need adjustment.
Table 17: Operational and Cost Risks
The following table is a summary of operational and cost risks that frequently affect F&B businesses.
| Risk or Challenge | Related Business Model Canvas Block | Potential Business Impact | Possible Mitigation |
|---|---|---|---|
| Food cost inflation | Cost Structure, Key Partnerships, Value Propositions | Margin erosion, menu repricing pressure, and reduced profitability | Renegotiate sourcing, adjust menu mix, and improve portion control |
| Supply chain disruption | Key Partnerships, Key Resources, Key Activities | Stockouts, inconsistent quality, and an inability to serve demand | Diversify suppliers, hold safety stock, and redesign substitute options |
| Food safety and regulatory compliance | Key Activities, Key Resources, Customer Relationships | Legal penalties, reputational damage, and customer distrust | Enforce SOPs, training, audits, and traceability controls |
| Labour shortages and high staff turnover | Key Resources, Key Activities, Cost Structure | Service inconsistency, rising labour costs, and weaker execution | Improve training, scheduling, retention, and role standardisation |
| Inconsistent product quality | Value Propositions, Key Activities, Customer Relationships | Lower repeat purchase, negative reviews, and brand damage | Standardise recipes, monitor output, and strengthen supervision |
| Low profit margins | Revenue Streams, Cost Structure | Limited reinvestment capacity and financial vulnerability | Improve pricing discipline, upselling, and waste reduction |
| High rental and operating costs | Cost Structure, Key Resources | Outlet profitability pressure and expansion constraints | Optimise space productivity, renegotiate terms, and refine location strategy |
| Technology and ordering system failures | Channels, Key Resources, Key Activities | Order disruption, poor customer experience, and lost sales | Maintain backups, vendor support, and process contingencies |
Table 18: Market, Channel, and Growth Risks
The following table is a summary of market, channel, and growth risks that can weaken the business model over time.
| Risk or Challenge | Related Business Model Canvas Block | Potential Business Impact | Possible Mitigation |
|---|---|---|---|
| Changing customer preferences | Customer Segments, Value Propositions, Revenue Streams | Demand decline, menu irrelevance, and lost market share | Track trends, refresh menus, and test new offers quickly |
| Intense competition | Customer Segments, Value Propositions, Channels | Price pressure, lower differentiation, and weaker traffic | Sharpen positioning, improve customer experience, and build loyalty |
| Dependence on delivery platforms | Channels, Revenue Streams, Customer Relationships | Commission pressure, weak margins, and low customer ownership | Build direct ordering channels and diversify acquisition |
| Demand fluctuations | Customer Segments, Revenue Streams, Channels | Volatile cash flow and weak capacity utilisation | Use promotions, diversify occasions, and balance channels |
| Brand reputation damage | Customer Relationships, Value Propositions, Channels | Customer loss, negative publicity, and slower recovery | Strengthen quality control, service recovery, and communication |
| Franchise quality-control issues | Key Partnerships, Key Activities, Value Propositions | Inconsistent customer experience across outlets | Enforce franchise standards, audits, and training systems |
| Difficulty scaling operations | Key Activities, Key Resources, Key Partnerships | Growth inefficiency and declining consistency | Build SOPs, modular processes, and scalable support systems |
These risks affect multiple blocks because F&B business models are tightly connected. A delivery system failure is not only a channel issue. It may also reduce revenue, damage customer relationships, and weaken the value proposition. A labour challenge may reduce speed, quality, and consistency at the same time.
The most resilient operators therefore manage risk at the business model level, not only at the operational issue level. That approach leads to more coordinated decisions and better long-term control.
7. Practical Recommendations for Strengthening a Food and Beverage Business Model Canvas
F&B businesses can strengthen their Food and Beverage Business Model Canvas by making deliberate choices rather than reacting to day-to-day pressures alone. The first priority is customer understanding. Operators should identify their most important segments, understand what each group values, and avoid trying to serve everyone with one generic concept. Clear segmentation leads to better menu design, pricing, service levels, and channel decisions.
Menu strategy should be tied to both customer demand and operational economics. High-complexity menus often increase training burden, preparation time, wastage, and inconsistency. Simpler, well-engineered menus usually improve speed and margin control. Pricing should be reviewed with clear visibility into contribution margin, channel commissions, and perceived customer value rather than using competitor prices alone.
Cost control should focus on disciplined execution. Ingredient usage, portion consistency, labour productivity, packaging costs, and spoilage all need regular review. Supplier management also deserves more strategic attention. Multiple qualified suppliers, better forecasting, and structured vendor evaluation can improve resilience and reduce disruption risk.
Technology should support convenience, control, and data visibility. Ordering systems, loyalty tools, POS analytics, and inventory dashboards can improve both service and decision-making. Channel diversification is equally important. Businesses that rely too heavily on one outlet format or one delivery platform face higher vulnerability.
Finally, F&B businesses should review their model continuously. Customer behaviour changes, costs shift, and competitive standards evolve quickly. The strongest operators treat the Food and Beverage Business Model Canvas as a living management tool, not a one-time planning exercise.
8. Related Food and Beverage Business Model Canvas Examples
The Food and Beverage Business Model Canvas becomes more useful when it is viewed through real business examples. Theory explains the structure, but company case studies show how the same framework can be applied in very different ways across restaurants, beverage brands, dessert chains, convenience retail, and mass-market food concepts. Looking at related Food and Beverage Business Model Canvas examples helps readers understand how customer segments, value propositions, channels, revenue models, partnerships, and cost priorities shift depending on the brand’s target market and operating model.
In practice, no single F&B business model fits every company. A casual dining chain may rely on dine-in experience and menu breadth, while a beverage franchise may win through affordability, brand visibility, and rapid expansion. A mass-market restaurant can be built around volume and fast service, whereas a global beverage company may depend more on distribution scale, bottling partnerships, and brand power. Comparing these models makes the framework more practical because it shows how each block changes according to strategy, format, and scale.
Table 19A: Related Food and Beverage Business Model Canvas Examples
The following table is the first set of related examples that show how different F&B brands apply the business model canvas.
| F&B Business Model Canvas Example | Business Type | What Readers Can Learn |
|---|---|---|
| Secret Recipe Business Model Canvas | Casual dining and café chain | How menu variety, dine-in experience, and brand familiarity work together |
| Richiamo Coffee Business Model Canvas | Coffee chain | How affordability, outlet accessibility, and repeat beverage purchases support growth |
| Pelita Nasi Kandar Business Model Canvas | Casual dining restaurant chain | How strong local demand, menu familiarity, and round-the-clock operations shape the model |
| Tealive Business Model Canvas | Beverage chain | How branding, innovation, and franchise expansion drive scale |
| Mamasab Bakery Business Model Canvas | Bakery and dessert business | How product branding, homegrown demand, and channel diversification support growth |
| Nippon Sushi Business Model Canvas | Japanese casual dining chain | How dine-in experience, menu breadth, and premium casual positioning work together |
Table 19B: Related Food and Beverage Business Model Canvas Examples
The following table is the second set of related examples that broaden the comparison across additional food and beverage brands.
| F&B Business Model Canvas Example | Business Type | What Readers Can Learn |
|---|---|---|
| Indofood Business Model Canvas | Packaged food company | How scale, manufacturing strength, and distribution reach create competitive advantage |
| Rumah Makan Sederhana Business Model Canvas | Padang restaurant chain | How standardised menu expectations and broad market appeal support expansion |
| Marugame Udon Business Model Canvas | Japanese fast-casual restaurant chain | How open-kitchen experience, product consistency, and efficient service reinforce the model |
| Bakmi GM Business Model Canvas | Noodle restaurant chain | How menu focus, operational consistency, and strong brand recall sustain growth |
| Satay Kajang Haji Samuri Business Model Canvas | Satay restaurant chain | How signature products, destination dining, and local brand equity shape the model |
| Kopi Kenangan Business Model Canvas | Coffee chain | How digital convenience, brand positioning, and scalable beverage formats support expansion |
Each of these examples highlights a different strategic logic within the broader food and beverage space. Secret Recipe illustrates how variety, accessibility, and familiar brand positioning can support a broad customer base. Richiamo Coffee and Kopi Kenangan show how beverage-led models can grow through convenience, strong branding, and repeat purchases. Pelita Nasi Kandar, Rumah Makan Sederhana, Bakmi GM, and Satay Kajang Haji Samuri highlight how core menu strength and local appeal can anchor growth. Indofood reflects the power of large-scale manufacturing and wide distribution.
Taken together, these examples help readers move from framework to application. They also make it easier to identify which type of F&B model is most relevant to a specific business idea, market segment, or growth strategy. For readers exploring your blog, this section provides a natural next step by linking foundational understanding with brand-specific analysis.
9. Conclusion
The Food and Beverage Business Model Canvas provides a practical framework for understanding how F&B businesses create, deliver, and capture value. It helps entrepreneurs, operators, and decision-makers move beyond isolated operational issues and view the business as an integrated system. Customer segments, value propositions, channels, relationships, revenue streams, resources, activities, partnerships, and costs all influence one another.
A strong F&B business model is built on alignment. Customer needs must connect clearly to the value proposition. Operational capabilities must support what the brand promises. Revenue generation must be strong enough to sustain the required resources, partnerships, and service levels. Cost management must protect profitability without weakening the experience customers are paying for.
The Value Proposition Canvas adds further depth by helping businesses test whether their offerings genuinely match customer jobs, pains, and gains. That is especially valuable in F&B, where customer choice is driven by a combination of taste, convenience, trust, price, speed, health, and experience.
Market conditions in food and beverage change constantly. Consumer behaviour evolves, supply costs fluctuate, technology reshapes channels, and competition keeps increasing. For that reason, both the Business Model Canvas and the Value Proposition Canvas should be reviewed regularly. Businesses that adapt their models thoughtfully can stay relevant, resilient, and commercially successful over time.
Disclaimer: This article is provided for educational and business analysis purposes only. Its content is based on general business concepts, market observations, and strategic interpretation. It does not constitute financial, legal, tax, investment, or professional advisory advice. Any brand names, trademarks, logos, and related materials mentioned remain the property of their respective owners.